Raw Waves Settings
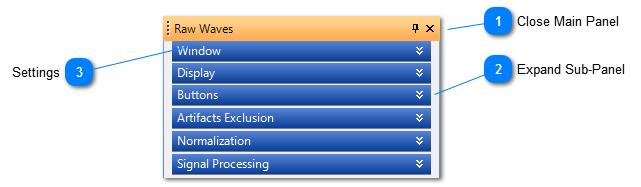
Raw Waves are EEG/ERP data which has not been averaged.
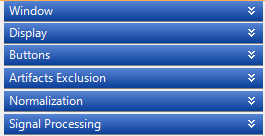
Window
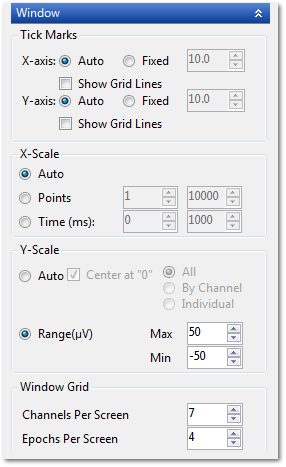
Sets the window parameters for data plotting.
Display
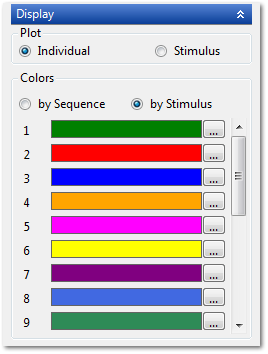
Sets how the data will be color coded.
Buttons
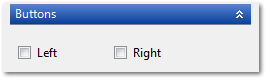
Specifies whether the button presses will be displayed.
Artifacts Exclusion
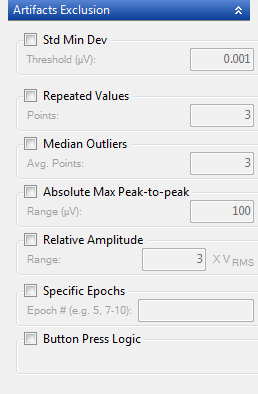
Controls what Artifacts are to be excluded from the display set. If an artifact is detected in any epoch on any channel, that epoch is excluded from all channels.
|
Threshold (µV):
|
ERPs whose standard deviation of all points within the epoch is greater than the threshold.
|
|
# of Points:
|
ERPs that have amplitudes within an epoch which are repeated # of times in a row.
|
|
# of Points:
|
Find the median amplitude (Am) for all epochs in each channel. Calculate the absolute difference (Dabs) between the amplitude of each point (Ap) and the median amplitude (Am). Average the # largest differences (Dmax). Exclude ERPs which have any point outside the range (Am ± Dmax).
|
|
Range (µV):
|
ERPs with a point outside the range of (± the absolute value of the highest amplitude (positive or negative) within the epoch.
|
|
# Multiple:
|
ERPs with a point with absolute value greater than # times the RMS peak-to-peak amplitude.
|
|
Epoch # (e.g. 5, 7-10):
|
Specifically identified ERP epochs.
|
Normalization
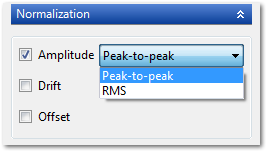
Controls how the data will be normalized before plotting.
|
|
|
Scales the amplitudes by setting the absolute peak-to-peak range to ± 1.0.
|
|
Scales the amplitudes by setting the absolute RMS range to ± 1.0.
|
|
Calculates a straight line curve fit for each epoch and rotates the data so that this curve fit becomes the new Y0-axis.
|
|
Calculates the average of the prestimulus interval and offsets the baseline this amount.
|